OpenWhisk Performance Improvement
Jul 24, 2018OpenWhisk community is nowadays getting more consistent on the new design of architecture for performance improvement. The future architecture of OpenWhisk requires large internal breaking changes. To fill the gap from idea into smooth migration, there might be helpful if a mid ground exist to clear more issues. Hence, I’ve worked on prototyping performance improvement in real, but not that comprehensive though. However, hope this prototype hold a place for deeper discussion and discover all issues might meet in the future.
This post may have two kinds of target audiences, OpenWhisk community, GSoC mentors and reviewers:
For OpenWhisk community:
The objective of this post and protoype:
- Draft an experimental prototype of OpenWhisk future architecture, for knowing all issues might meet.
- Hope to help community migrate to the futrue architecture smoothly.
- Might be a starting point for further discussion.
Something didn’t implement/discuss in this post and experiment:
- Kubernetes: I only do prototyping for native (docker) side.
- Logging.
- Performance optimization on message queue.
- Error path and tests.
- Controller HA.
- Scheduler persistence.
For GSoC mentors (Rodric and Carlos) and reviewers:
This will be my final result during GSoC progress. But in GSoC guidance, please refer to here for non-technical description.
Full code can be found here.
Architecture recap
The Future Architecture proposal proposed by Markus Thommes integrated lots of communities’ idea; play a great start to a new performant architecture.
Steps to produce
Instead of prototyping from clean slate, it’s quite more challenged established via current codebase, but take more advantages:
- More accurate comparison on performance and architecture.
- Help to explore the migration path.
- Help me to better understanding on OpenWhisk internal implementation.
However, OpenWhisk already provides nice infrastructure and utilities that I can easier to migrate this. As I mentioned, one of targets on this experiment can help to figure out the smooth migration path to future architecture. I’ve tried my best not to break up current codebase and kept rebase it with upstream.
The prototyping steps as follow:
- A New LoadBalancer SPI: SingletonLoadBalancer.
- Container Manager who manages container resources.
- Re-use and refactor invoker-agent which is used by Kubernetes deployment.
- In-detail implementation.
I’ll discuss these in detail below.
For cleaner naming convention, I’ve renamed some words from proposal, here’s the mapping:
- Container Management Agent -> InvokerAgent
- Container Manager -> Scheduler
Controller
Most of Controller logic and programming semantics will not be changed, except for LoadBlancer. I’ve created a new LoadBalancer implementation in future package and can be simply loaded with SPI infra. I’ve not done the protocols with multiple Controllers, there’s still some problems need to clarify that I’ll point out below.
The overall LoadBalancer workflow as following:
- Call publish activation
- Check if there’s a warmed action existed, by looking up local container list.
- If yes and if it’s belong to owned, http call for it. (Else, redirect to another controller with carrying http client context.)
- If not, queue in OverflowProxy and put the activation in the overflow queue.
- Request for new resource, via proxy actor (sub actor in OverflowProxy actor) to Scheduler singleton.
- After scheduler singleton’s response arrived, update local container list (which generated via scheduler).
- If it’s belong to owned, http call for it. (Else, redirect to another controller with carrying http client context.)
The code module contains:
Singleton LoadBalancer
SingletonLoadBalancer implements LoadBalancer trait for SPI infra. Contrast to prior ShardingContainerLoadBalancer, we’ll contain nothing about scheduling logic; it’ll simply look up and pass requests. When a request come in, it’ll lookup container lists, which contains some context related to container and in-flight concurrent requests. There will be some larger value once concurrent activation processing got finished, but current, the in-flight concurrent request can be only 0 or 1. That is, if a request reach 0 concurrency value, it reuse the existed free container and send request into ContainerProxy, or else, it’ll send message to OverflowProxy for resource requisition.
Overflow Proxy
Once OverflowProxy get message, it’ll queue into Overflow Buffer. I didn’t take external shared queue here, which many folks may concerned. But for Controller HA mode, it’ll be required and can open up work-stealing capability. Anyway, the current implementation when receiving OverflowActivationMessage, queue in OverflowBuffer with some sendor and tracing context, and proxy to SingletonScheduler; and once it gets back with ContainerAllocation message, it’ll pipe back to SingletonLoadBalancer.
Container Proxy
ContainerProxy is similar to prior invoke one, but I’ll only manage with Suspend/Resume states and face to a warmed container. Therefore, the mission on ContainerProxy will operate suspend/resume (depends on pauseGrace settings) and call /run route of containers. Finally, pipe back result to SingletonLoadBalancer.
In order to make sure the correctness, I’ve introduced two synchronized values here. It’ll cause some problems while an in-flight activation is running but timer tick triggers and pause container. Therefore, it takes some paused here.
ShareStates Proxy
Concerned some proposal didn’t mention, the real Scheduling algorithm; We don’t have any workload-dispatch related logics in Controller side, and make Scheduler holds all logics. However, what states Scheduler should know?
Consider building the prior busy/free/prewarmed pooling model:
- How do we know that which Container is busy and which is free?
- How do we know that which Container is safe to delete and notify deletion?
ShareStatesProxy do this: when Container gets pause/suspend, it’ll notify Scheduler that container is busy or free. Once a deletion is being taken, it’ll choose up from free pool (see more in Scheduler section) and notify back with ShareStatesProxy. Hence, ShareStatesProxy take an eval sharable container lists (actually a TrieMap) for updating and sharing with main SingletonLoadBalancer.
Container Factory Protocol
Overall for interacting with Scheduler, the messages between Controller and Scheduler. You can see that the relations between Controller and Scheduler.
In convenient, I’ve used Akka message passing, but this might not be ideal.
Scheduler
The Scheduler is responsible for handling controller resource requisitions, monitoring and (partially) mangaging containers’ lifecycle. In the overall design, it’s similar to most logic from prior Invoker, but without pause/resume operations. I didn’t deal this with Kubernetes. However, the approach may be similar and much simpler. Further, the new open source knative project might make the architecture further changed to adapt with Kubernetes.
To guarantee strong consistency for container selection in controller. The scheduler will be (contains) a cluster singleton to resolve container selection. Akka cluster singleton is introduced here: ClusterSingletonManager will sits in Scheduler and ClusterSingletonProxy will sit in both Controller and Scheduler to access the singleton. You can checkout the doc for usage and here’s my example with less noise compared to Akka provided, which contains a basic singleton and proxy setup with migration observation guide. This enabled us to use with some convenience, i.e. failure recovery, message buffering, etc.
Container Pool Model
Basically, I didn’t change the model of container pool: busy/free/prewarm model. Simply review on this model with additional context introduce from new LoadBalancer design:
- Once the scheduler start, it’ll create prewarm containers (via stem cell config).
- A new request come in, it’ll first match if there is a free and warmed container.
- If yes, take it.
- If not, match the prewarm with structural matching (kind, mem, etc.); If yes, take it.
- If not, checkout there’s enough slots, if yes, create one and take it.
- If not, remove one container from free pool, create new one and take it.
- Else, all containers are busy, we’ll reject this request.
The free and busy states are notified via ShareStatesProxy we have described above, caused by Container’s suspend and resume.
The algorithm is definitely not optimal, but we can first leave out previous problem: invokers have no visibility with each other.
Container Orchestration
The Container Pool Model is based on single pool abstraction, to accomplish this model. We still need to have internal real resource allocation. The approach will be distincted by two orchestration choices: Kubernetes and Native (Docker).
-
Kubernetes: Basically, we just call kubernetes api server with 1 to 1 mapping, it’ll deal with all scheduling, health check and so on. Hence, in this case, the resource allocation is done by Kubernetes scheduling policy, with already well-defined resource matching and algorithm.
-
Native(Docker): Contrast to indirectly calls in Kubernetes, in the native way, we’ll have to deal everything by us. I’ve introduced a simple and straight-forward algorithm: assign container to a node who has enough resources. This is definitely not ideal, i.e. node search is not scalable, easy fragmentation, etc. We can further improve this in the future.
You may find that there’s an operation on port assignment. In order to do direct http calls, how can we reach warmed container after NAT environment?
In Kubernetes network model, the ip-per-pod model is flattened and we can easily work without this problem. But to the native mode, the warmed containers required some mechanisms to resolve with NAT environment.
There are some potential ways:
-
Use InvokerAgent as a reverse proxy: this will take some additional benefits => reduce the calls after pause/resume, since Controller will no longer managed any Container’s lifecycle. However, this is quite similar to prior Invoker, may gain some latency here.
-
Forced user to use somewhat overlay/underlay network policy, to reach a similar model in Kube.
-
Port-forwarding once creation.
Obviously, it’s arbitrary and not applicable for option 2. I choose 3 from now.
New Container Trait
The responsibility on operating containers are segarated now:
- Pause/Resume on Controller.
- Creation/Deletion on Scheduler.
- Log on InvokerAgent.
I’ve splitted these into several different traits: ContainerRunnable for Controller side (ContainerProxy mixin it), ContainerLog for Invoker Agent, CoarseGrainContainer for Scheduler side and ContainerRestCall for sharing capability on doing rest calls.
You can find more detail here.
Issues Remain
-
Perfromance bottleneck: Cluster singleton can easily reach performance bottleneck, therefore, we should try our best to reduce workload on it. First, the sophisticated scheduling should be scalable on large scale nodes: in Kubernetes, the scheduling is done by kube-scheduler (within API server). The better way is that Docker side should be also standalone as well, we can figure out later. Second, in which proposal didn’t mention, to keep the free/prewarm/busy model the pause/unpause messages handling; they will be sent by every pause grace (500ms default) reach or new calls arrived.
-
Single point of failure: akka cluster singleton will automatically migrate to another scheduler node (actor-system) once the leader (oldest) getting down. This will result in short downtime, but it can be afford to us however, the ClusterSingletonProxy will buffer messages until the new singleton is up; the latency is overall make sense b.c. this is not actually the performance critical path.
Some other issues I’ll discuss below.
Invoker Agent
Prior on Kubernetes deployment in OpenWhisk, it already has an invoker-agent do some similar jobs (pause, resume and log); and hence works fine for me with some basic refactoring.
However, this may not meet OpenWhisk requirements:
-
One siginificant bottleneck and many folks concerned: activation log. We already had plenty of log store implementation, i.e. elasticsearch, docker file, etc. In general, we should not pass logs from whisk agent back to either Controller or Whisk Scheduler. Instead, directly store activation log into log store. Therefore, we can and we should reuse the codebase from implemented log store.
-
Better integration: Go has it’s own workspace and directory convention ($GOPATH). It’s neccessary if need a mature dependency management, i.e. dep. By convention, we might locate it into some kind of path: github.com/apache/incubator-openwhisk-invoker-agent, in other word, a separate repo; this definitely makes the project fractionized. Therefore, I vote for using scala-based implementation on InvokerAgent.
Regardless which one to be reused, InvokerAgent is not the main target I’m going to verify it. Use it is fined here, currently.
Basic functionalities of InvokerAgent:
- Suspend: suspend/pause a specific container.
GET http://whisk.agent.host/suspend/container
Will return status 204 on success and 500 on failure.
- Resume: resume a specific container.
GET http://whisk.agent.host/resume/container
Will return status 204 on success and 500 on failure.
- Log: read container logs and collect to a log sink file, and return back with JSON structure.
GET http://whisk.agent.host/log/container
Will return status 204 on success, 500 on general failure and 400 on log parsing failure.
That’s all, there’s only small changed from previous version; for more implementation detial, you can refer to here.
Performance tests
It’s sadly I don’t have available resource to test the performance, simply use my macbook (2017, Core i5 2.3GHz, 8GB RAM, 128GB SSD) for benchmarking. For many reason (i.e. not sufficient resource, no runc optimization, resource interference, etc.), the performance is poor and not that accurate. Therefore, I can’t give the arbitrary conclusion on performance improvement; but we can observer further issues during load tests.
Environment
- MacBookPro 2017, Core i5 2.3GHz, 8GB RAM, 128GB SSD.
- Docker for mac, version 18.06.0-ce-mac69, edge channel.
- Tune docker machine to maximum value (4 vCPU, 8GB RAM)
Setup
For comparision, I’ve setup:
- A full set of OpenWhisk (current architecture) with 1 Nginx, 1 Controller, 1 Kafka, 1 CouchDB and 2 Invokers.
- New architecture of OpenWhisk with no Nginx (test via http), 1 Controller, 1 CouchDB, 1 Scheduler and 1 InvokerAgent (note that, the actual virtual node is two (2 container factories), but for local tests, I use 1 invokerAgent only).
- Same limitation(no limit), same slots (numOfCores * coreShares), 50 millis pause grace, etc.
- Benchmark via wrk, I’ve extended the original wrk tests in OpenWhisk to multiple actions version.
- Running 1 action tests for 5 minutes and 4 action tests for 5 minutes.
- wrk args: 10 * (number of actions) concurrency, 4 threads.
- Benchmark are all start from 4 prewarmed containers.
Note that I’ve tried many times, the results are similar.
Current architecture: 1 action
As you can see, the resources are definitely overloaded. Note that it’s not an accurate average latency under normal throttling.
4 threads and 10 connections
  Thread Stats   Avg      Stdev     Max   +/- Stdev
    Latency   205.85ms  255.04ms   4.08s    85.18%
    Req/Sec    16.89     10.71    60.00     64.42%
  Latency Distribution
     50%   82.82ms
     75%  302.75ms
     90%  547.36ms
     99%  991.84ms
  15938 requests in 5.00m, 11.90MB read
Requests/sec:     53.11
Transfer/sec:     40.59KB
Current architecture: 4 actions
The benchamrk result is definitely meaningless, it’s heavily overloaded to run 4 actions. But the main reason leads to poor performance on 4 actions we already knows is the problem on no visiblity between Invokers. In addition, I’ve found that there are easily causing failure starting from clean system, therefore, I’ve post a pure start and a re-run result.
4 threads and 40 connections
  Thread Stats   Avg      Stdev     Max   +/- Stdev
    Latency     5.87s     2.69s    9.59s    64.52%
    Req/Sec     0.83      1.99    10.00     89.67%
  Latency Distribution
     50%    6.32s
     75%    8.11s
     90%    8.89s
     99%    9.59s
  323 requests in 5.00m, 247.36KB read
  Socket errors: connect 88542, read 0, write 0, timeout 292
Requests/sec:      1.08
Transfer/sec:     844.07B
4 threads and 10 connections
  Thread Stats   Avg      Stdev     Max   +/- Stdev
    Latency     1.38s     1.87s    9.79s    82.91%
    Req/Sec     6.73      5.87    48.00     82.41%
  Latency Distribution
     50%  390.06ms
     75%    2.11s
     90%    4.38s
     99%    7.45s
  3260 requests in 5.00m, 2.45MB read
  Socket errors: connect 0, read 0, write 0, timeout 2
Requests/sec:     10.86
Transfer/sec:      8.36KB
Video records for observation:
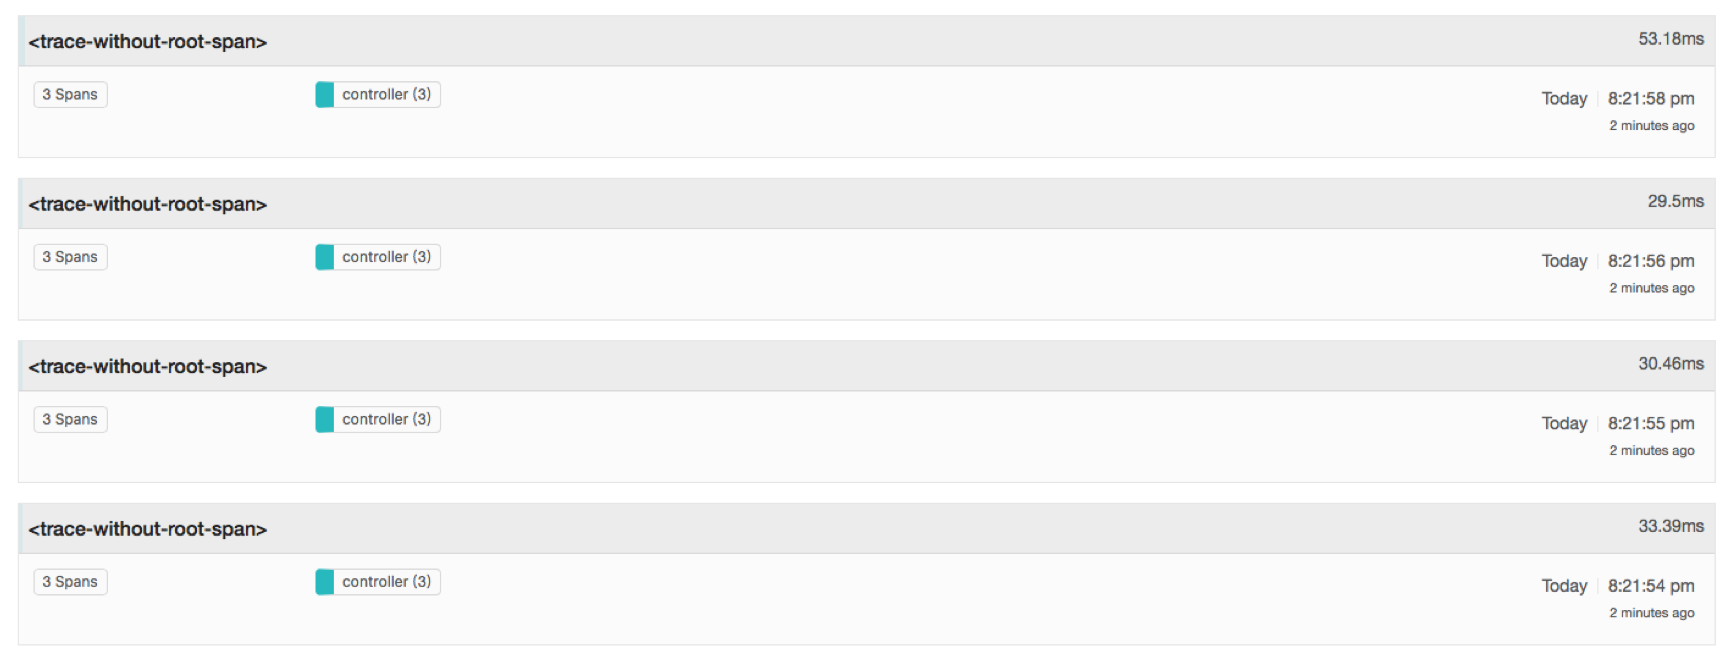
New architecture: 1 actions
In the new architecture, for 1 action, I think it’s arbitrary to say that it has greater performance, because of lacks of plenty functionalities (no logs collection, no ssl termination, etc). Please keep doubt to this estimated result. Note that you can see that there are some Non-2xx or 3xx responses, they are system rejection for overloaded, for early failure from scheduler, if all pools are in busy.
I’ve also found pause/resume bug during high load, I’ll described in the issue section at the bottom.
4 threads and 10 connections
  Thread Stats   Avg      Stdev     Max   +/- Stdev
    Latency    11.37ms   50.32ms   1.02s    98.91%
    Req/Sec   131.36     48.86   232.00     64.19%
  Latency Distribution
     50%    6.60ms
     75%    8.63ms
     90%   10.77ms
     99%   66.42ms
  51199 requests in 5.00m, 28.66MB read
  Socket errors: connect 0, read 0, write 0, timeout 27
  Non-2xx or 3xx responses: 27
Requests/sec:    170.62
Transfer/sec:     97.80KB
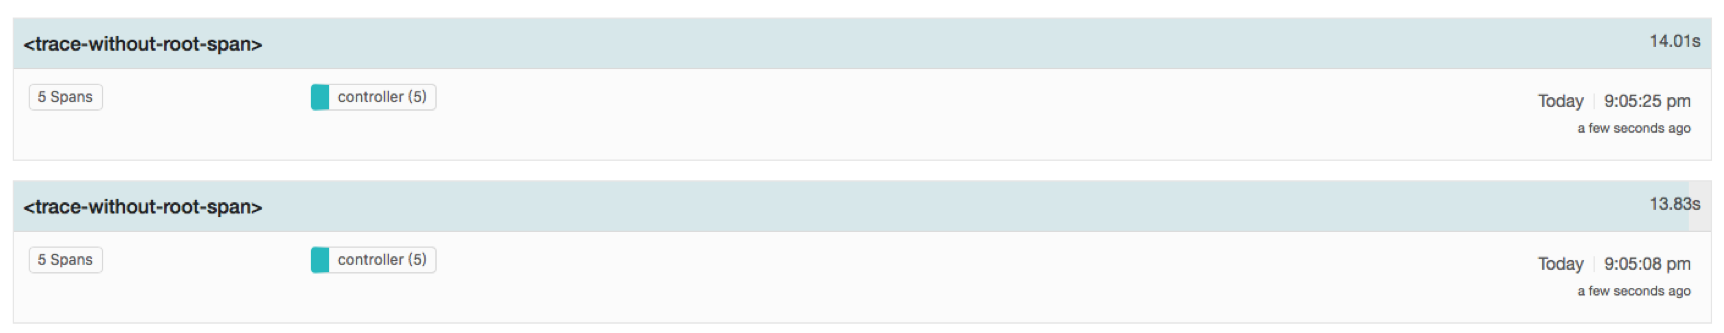
New architecture: 4 actions
As mentioned above, there is a pause/resume bug, therefore, the statistic is not accurate. Discuss below.
4 threads and 40 connections
  Thread Stats   Avg      Stdev     Max   +/- Stdev
    Latency   207.64ms  962.41ms   9.98s    95.05%
    Req/Sec    78.16     97.98   390.00     79.54%
  Latency Distribution
     50%    4.28ms
     75%    7.53ms
     90%   43.68ms
     99%    5.62s
  8268 requests in 5.00m, 4.94MB read
  Socket errors: connect 0, read 0, write 0, timeout 185
  Non-2xx or 3xx responses: 3665
Requests/sec:     27.56
Transfer/sec:     16.86KB
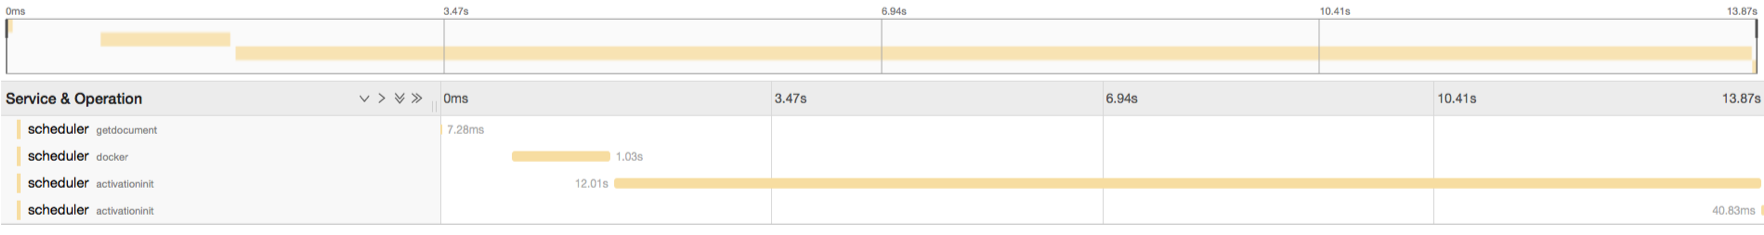
Latency
I’ve used tracing support with Jaegar UI for troubleshooting and latency observation. Jaegar is compatible with Zipkin trace and painless deployment.
There are some average latency metrics in wrk above, mainly for non-pausing/resuming operations (direct calls), basically under 10ms.
Here’s the tracing result for calls during warmed, but pause/resume. Latency gains for awaiting resuming.
In average, the latency on invocation averages in cross 10 seconds on my Mac; including container removal, create and initialization.
The bottleneck is initialization.
Conclusion & Discussion
There’s still plenty of things not being done, and the approach is not ideal either; I’ll keep work on this and hopes this help some OpenWhisk folks to join brain storming and find out the consistent design on future architecture of OpenWhisk.
Issues
It’s neccessary to provide a strong consistency (warmed) container lists to be kept in each controller, how do we deal with this?
Using cluster singleton in Scheduler is mainly for providing strong consistency on managing containers’ states. However, lookup states store in Scheduler will lead to poor performance (gains latency and makes singleton busy).
To release the burden and latency on lookup Scheduler, we can keep only owned container lists (actually a map) in each in-memory store (as I did and proposal mentioned that). However, introduce cache will cause temporary inconsistent. How do we solve this?
How do we deal with overflow messages?
There’s not consistent here due to issues related to message queues (i.e. unbounded topics, using pub/sub, etc.). I’ll experiment these further as well.
Problematics on ContainerProxy
In order to guarantee correctness, I’ve used blocking Await in ContainerProxy. There’s a potential problem is: when an activation is running, we can’t call pause on it. I’ll keep figure out this problem as soon as possible.
States for free/busy pool recognition?
Is the state related to free/busy == pause/resume?
There’s a potential tradeoff is: if pause/resume becoming bottleneck, we would like to use greater pause grace. However, greater pause grace means that the container pool is easier to be full of busy states. Ideally, in runc optimization, there’s no problem at all. However, in docker version pause/suspend, this may need to be concerned.
Peek container requisition.
When burst requests are coming (plenty of cold start occurred), the Scheduler will response to over-estimated resources to system. We should further introduce scheduling algorithm improvement. However, it’s great that we have a single place (Scheduler) to consider and experiment overall resource allocation.
Will it be performance bottleneck on Scheduler Singleton?
Actually, Scheduler can not only keep create and deletion states; as more states come in, will it be a performance bottleneck on large scale system?